
From September 1994 to September 1995, I have been working at the Konrad-Zuse-Institut (ZIB) in Berlin, Germany in the Department for Visualisation and Parallel Computing in cooperation with the TU Berlin. Have a look at the ZIB homepage, but just to point out one fact: They are running the fastest computer in Germany, a Cray T3E-900 (Multiprocessor Supercomputer).
My job was to visualize numerical data stemming from computer simulation of
polymer melts rheology.
To do this, I mainly used AVS
(Advanced Visual Sytems), a program that allows you to graphically assemble
a net of provided or your own modules and thereby produce a high-end
computer graphics application.
The flow of the melt is animated in movies and copied to Betacam.
Curious about the physics behind it?
Some pictures:
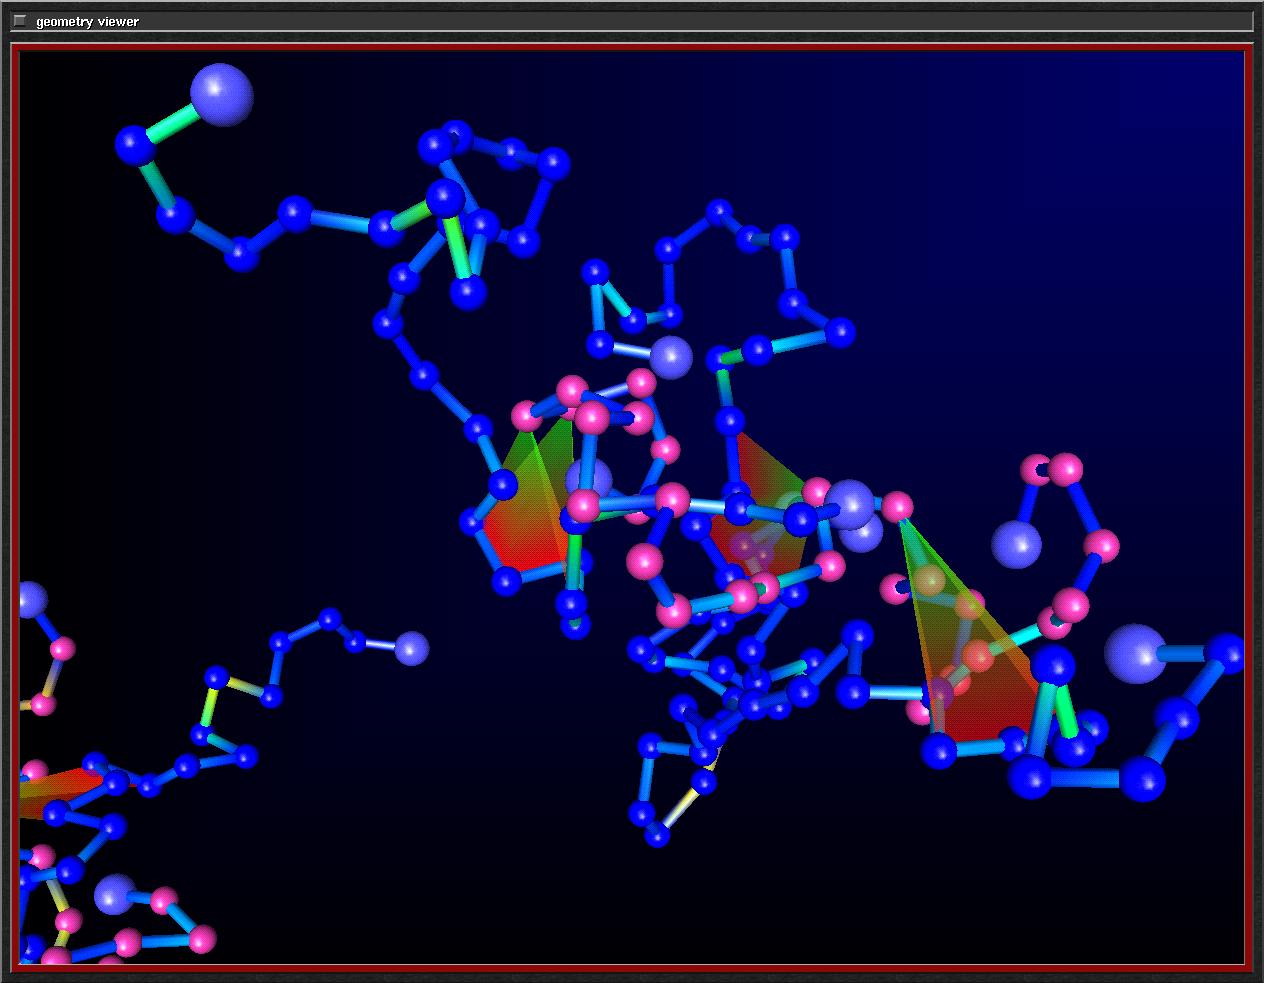
Background picture
Jpeg, 120 kB
This picture shows two entangled polymers in the classical "ball-stick"
representation. Different colors in the links correspond to interatomar
forces. One polymer has blue, the other pink atoms.
Entangled parts of the chains are emphasized by the ray-like red/green
triangles.
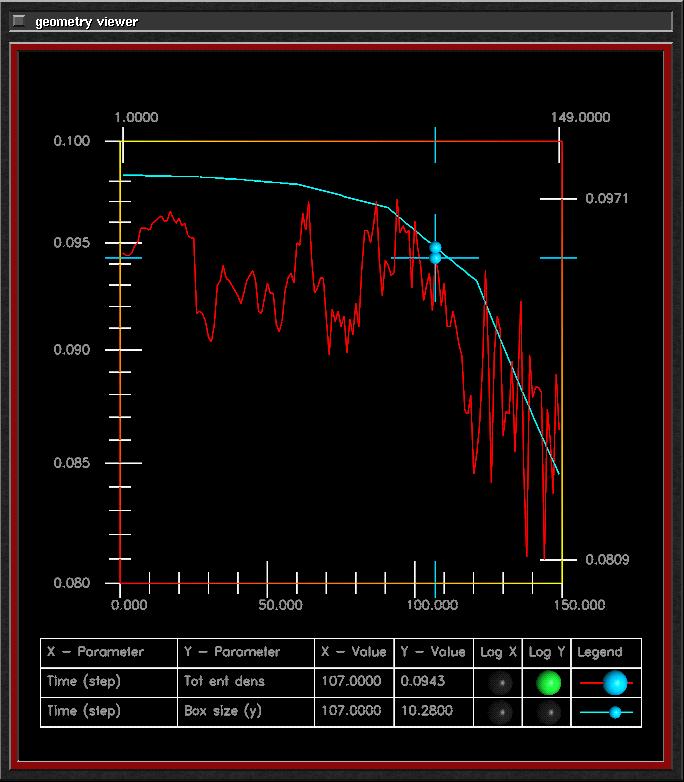 2D Plot
Jpeg, 68 kB
2D Plot
Jpeg, 68 kB
Representation of a scalar value like viscosity over time in a 2D-plot.
The plot is accumulating, that is, updated after every timestep.
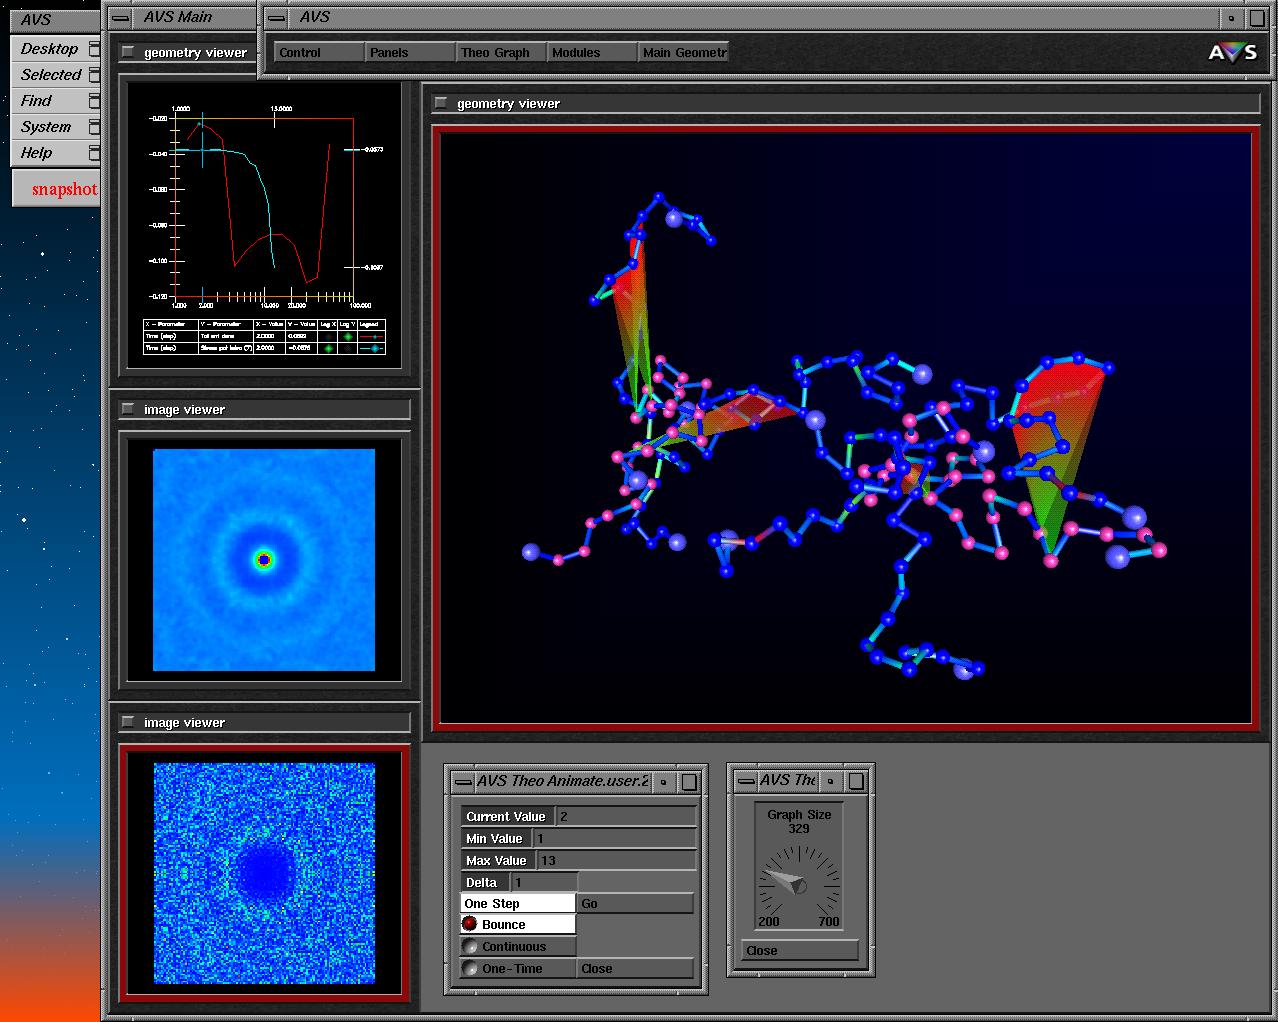 Entire AVS Page
Jpeg, 208 kB
Entire AVS Page
Jpeg, 208 kB
Complete AVS-Page with scatter diagrams (left), 2D-Graph and widgets
to control the animation.
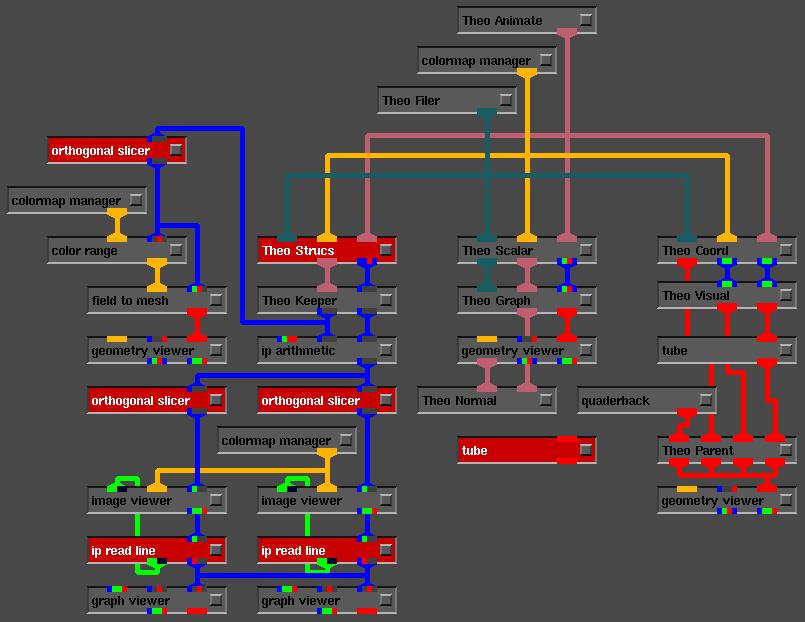 AVS Net
Jpeg, 64 kB
AVS Net
Jpeg, 64 kB
Connection scheme of the involved AVS modules to produce the page.

