Enrollment Information Updates
Due to the delays with the 2024-25 FAFSA, UMBC has extended the First Year Student Fall 2024 enrollment confirmation deadline from May 1 to May 15, 2024. For more information, please visit UMBC Financial Aid.
You Know WHY.
We Know HOW.
Join our creative, inclusive Retriever community.
Join Us for an Upcoming Undergraduate Admissions Event
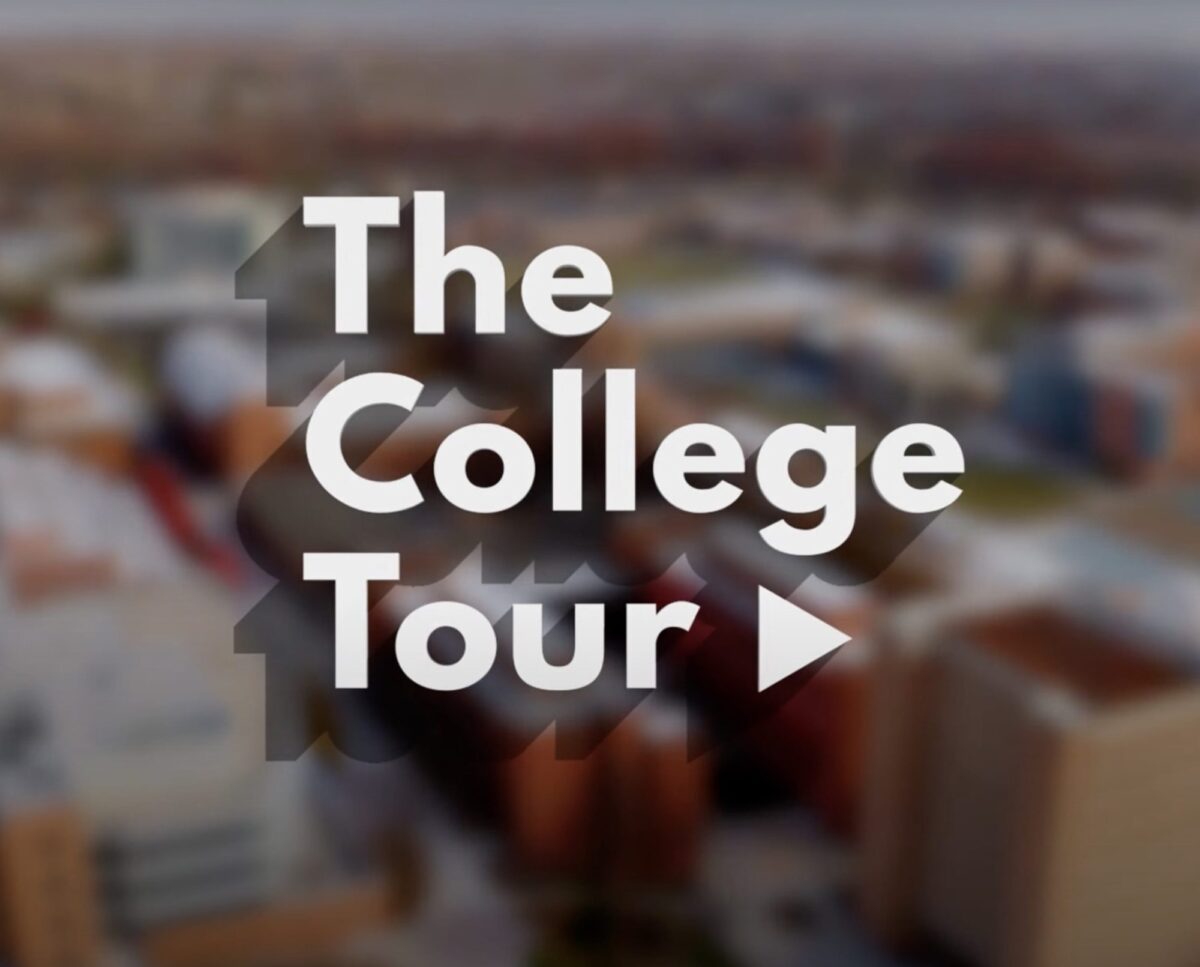
See UMBC Through Our Students’ Eyes
Get a virtual tour of UMBC like no other — through the personal experiences of our own students on UMBC’s episode of The College Tour.
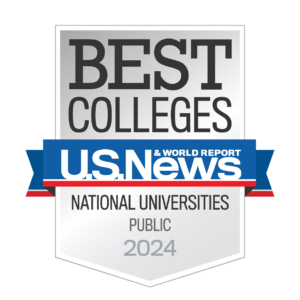
U.S. News highlights UMBC’s national leadership in teaching, innovation, and diversity.
This year’s rankings show UMBC jumping an impressive 25 spots on the list of Best National Universities and appearing on several other prestigious lists, distinguishing the university’s achievements on a national stage.

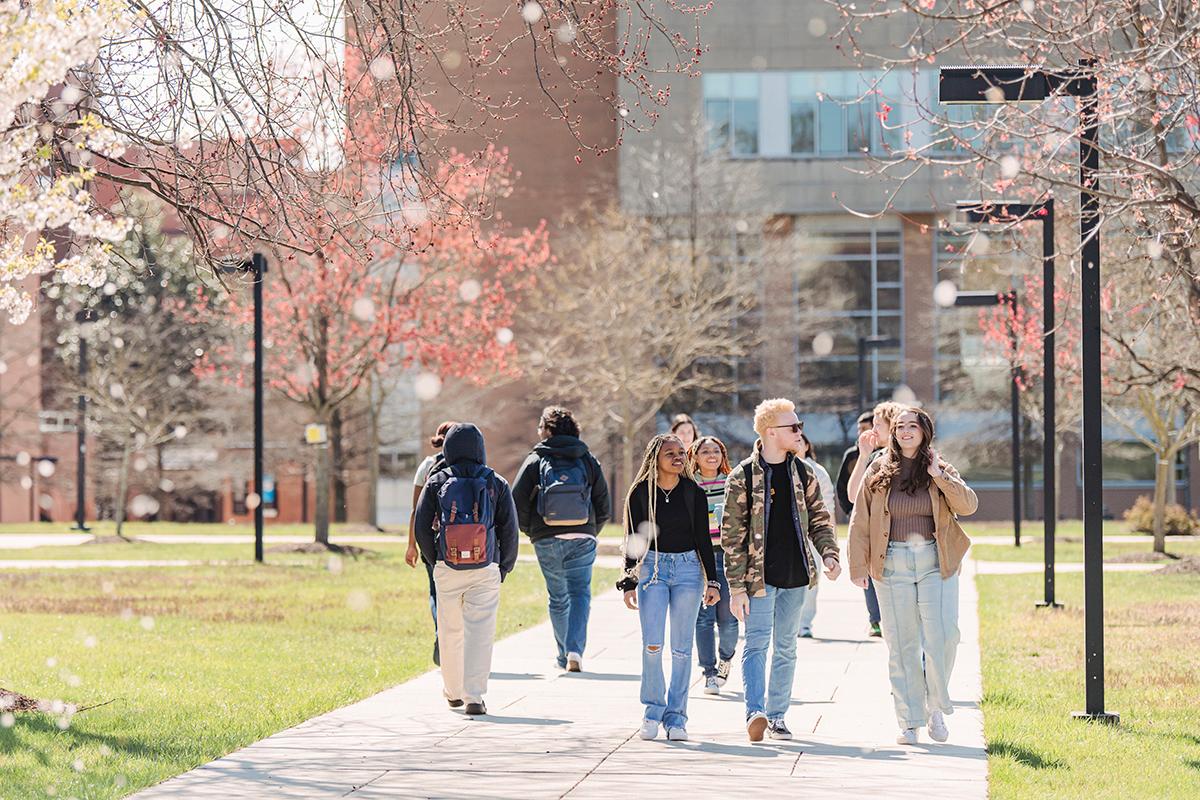
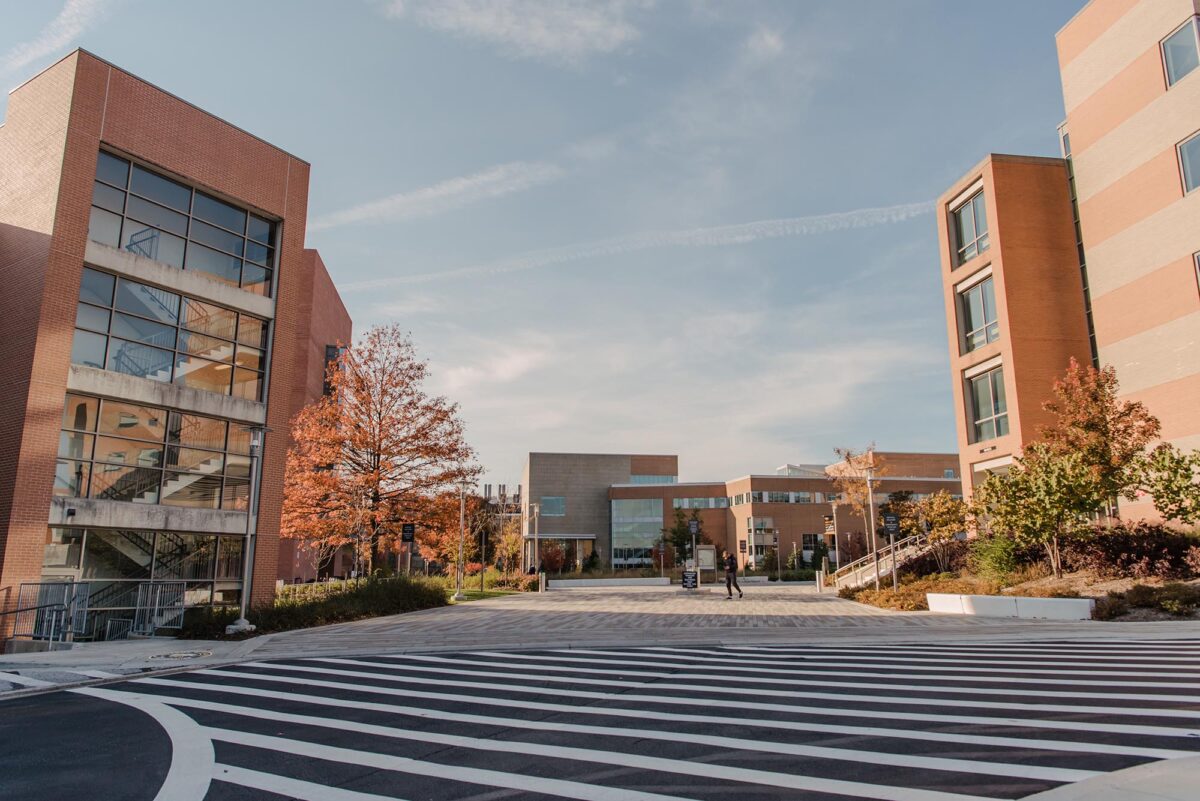
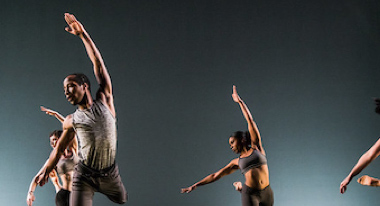
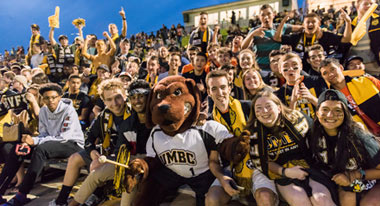
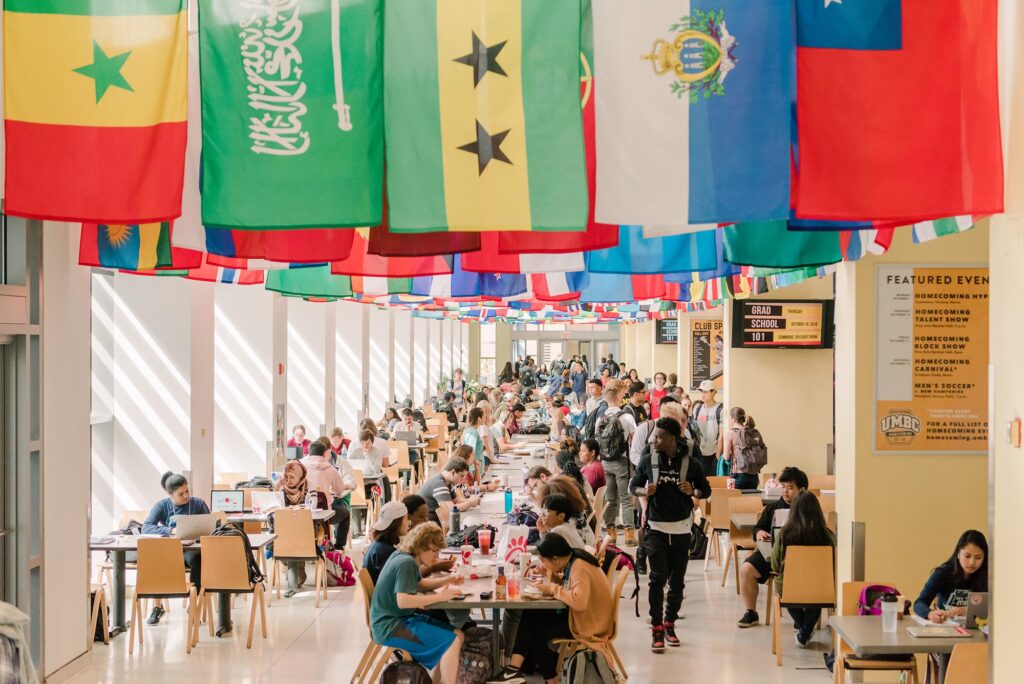
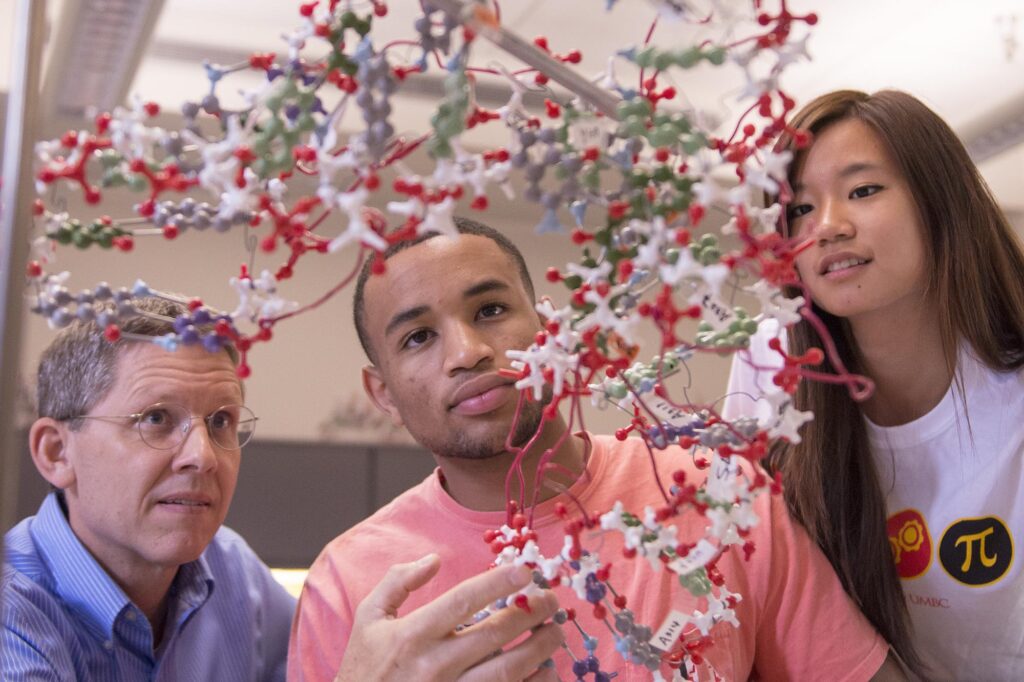
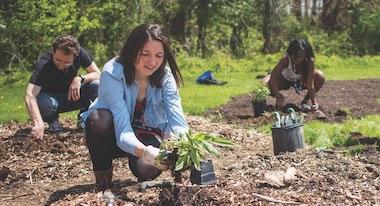
Life at UMBC
Our UMBC community is committed to helping you achieve excellence as a student and beyond. Whether breaking boundaries in the classroom and the lab, or stretching your limits on stage or the playing field, Retrievers are in it #UMBCTogether.

-
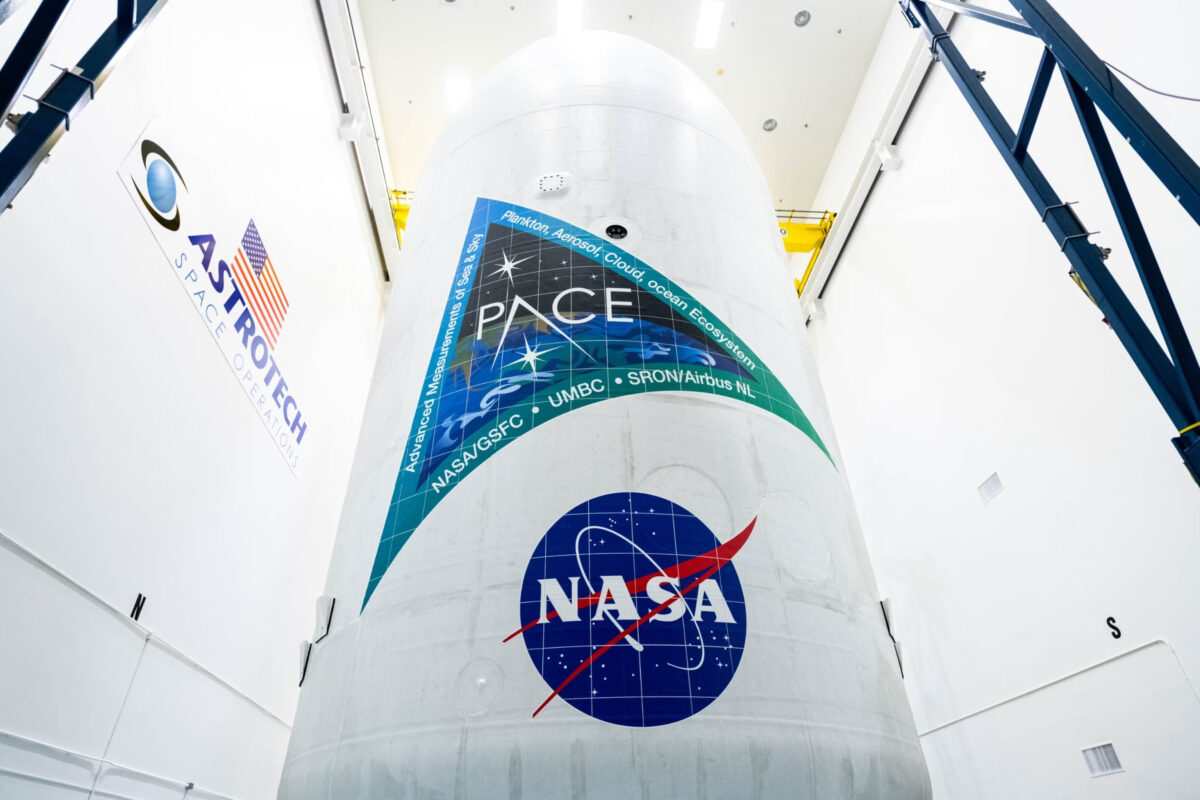
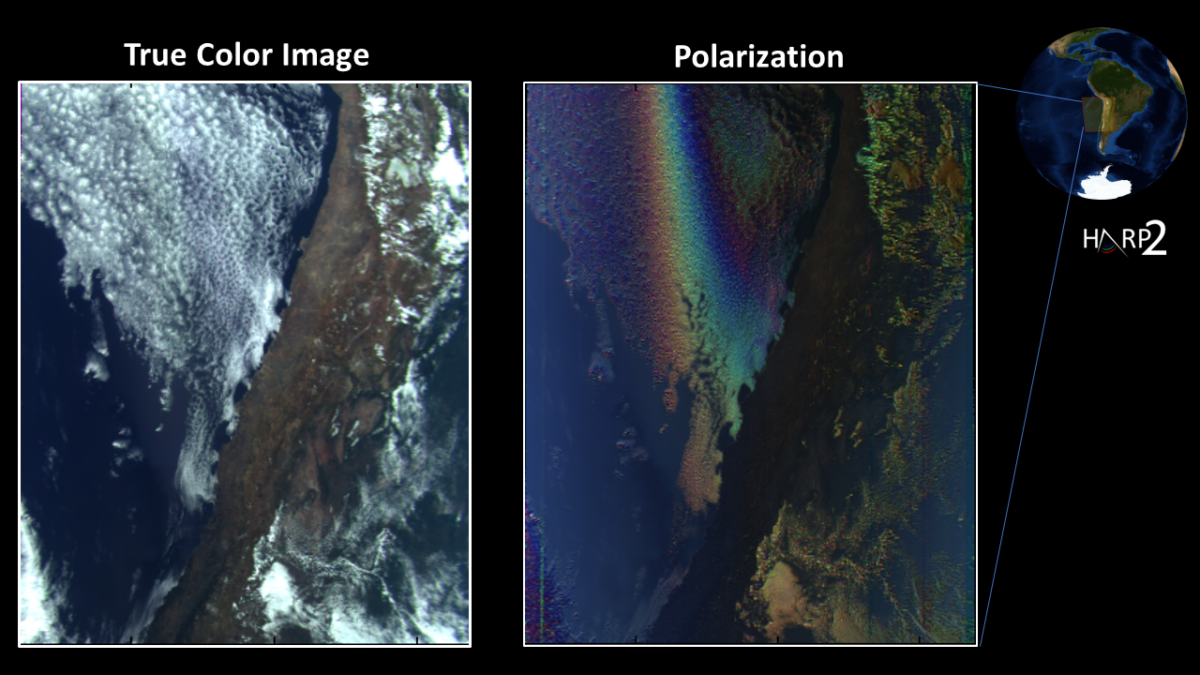
UMBC scientists and engineers celebrate launch of HARP2 instrument on NASA’s PACE mission
After over a decade of concerted effort, full of setbacks and recoveries, UMBC’s HARP team celebrated as the instrument they designed and built launched on PACE, a major NASA mission set to study Earth’s atmosphere and oceans. Continue Reading UMBC scientists and engineers celebrate launch of HARP2 instrument on NASA’s PACE mission