| Dr.
Nigel Crook of Stanford University and CUAHSI HMF
Geophyics was in residence from July 2 – 18, 2007 to carry
out the following work in collaboration with the Baltimore Waters
Testbed project: (1) Riparian zone geophysics – Ten transects across and around the stream channels in Dead Run watershed were characterized using resistivity, ground penetrating radar and seismic refraction. The aim was to delineate depth to bedrock and the water table topography as a function of distance from the river channel. Required ancillary data included a topographic survey using a total station and installation of piezometers for ground-truthing of water levels. The interpreted data will be incorporated into the groundwater model of Dead Run. (2) Microgravity survey - A semi-regional scale survey was conducted over the Gwynns Falls watershed and a smaller, higher-resolution scale survey was conducted around the Dead Run watershed. The survey consisted of placing a microgravity meter at selected locations and determining earth’s gravity at these points. The idea is that there is a greater gravitational pull under a point when pores are filled with water. Repeat measurements were taken at the same points in February 2008, which enabled calculation of the change in groundwater storage. This method has been previously applied to the Tuscon area by USGS. A map showing the point coverage of the region with the first gravity map is shown below. 90 data points were collected. A poster summarizing this work was presented at Fall 2008 AGU. The abstract can be viewed here. Interpretrions of data from both efforts have been summarized in a manuscript for submission to the journal Ground Water. |
|
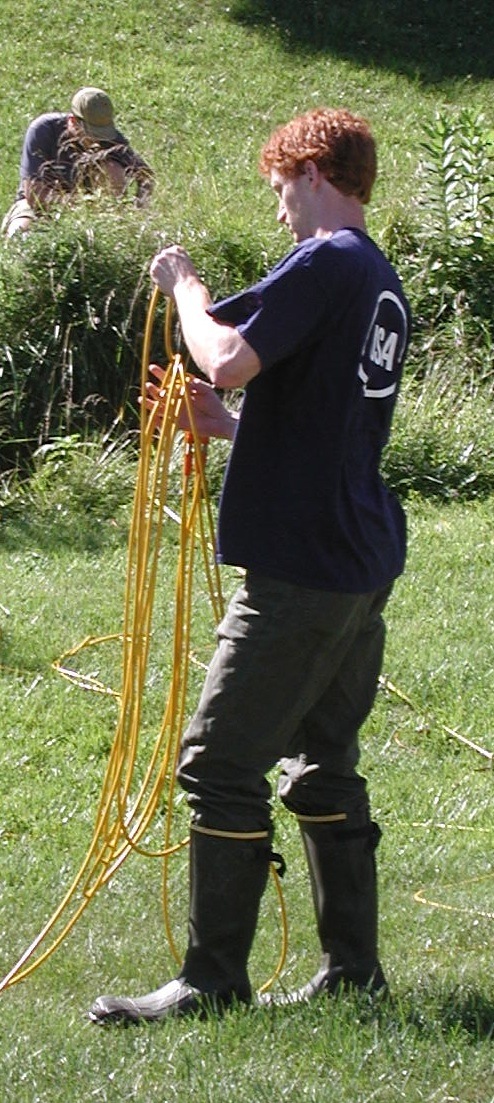
Locations in Dead Run chosen for geophysical transects. From downstream to upstream: locations 1, 4, 8, 9, 10, 11, 15, 16, 18, 20. |
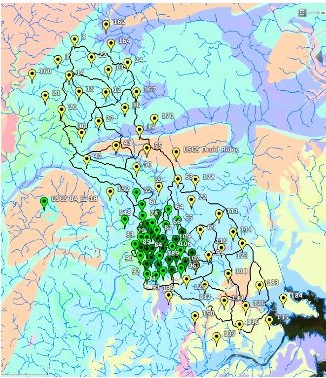 Locations in the Gwynns Falls watershed chosen
for the microgravity survey. Locations in the Gwynns Falls watershed chosen
for the microgravity survey. |
|
|
|
Top: Wenner electrode
configuration (provides greater sensitivity to horizontal variations in
resistance, greater depth pentration), 2m electrode spacing. MIDDLE:
With interpretation of water table depth and extent of sapprolite. |
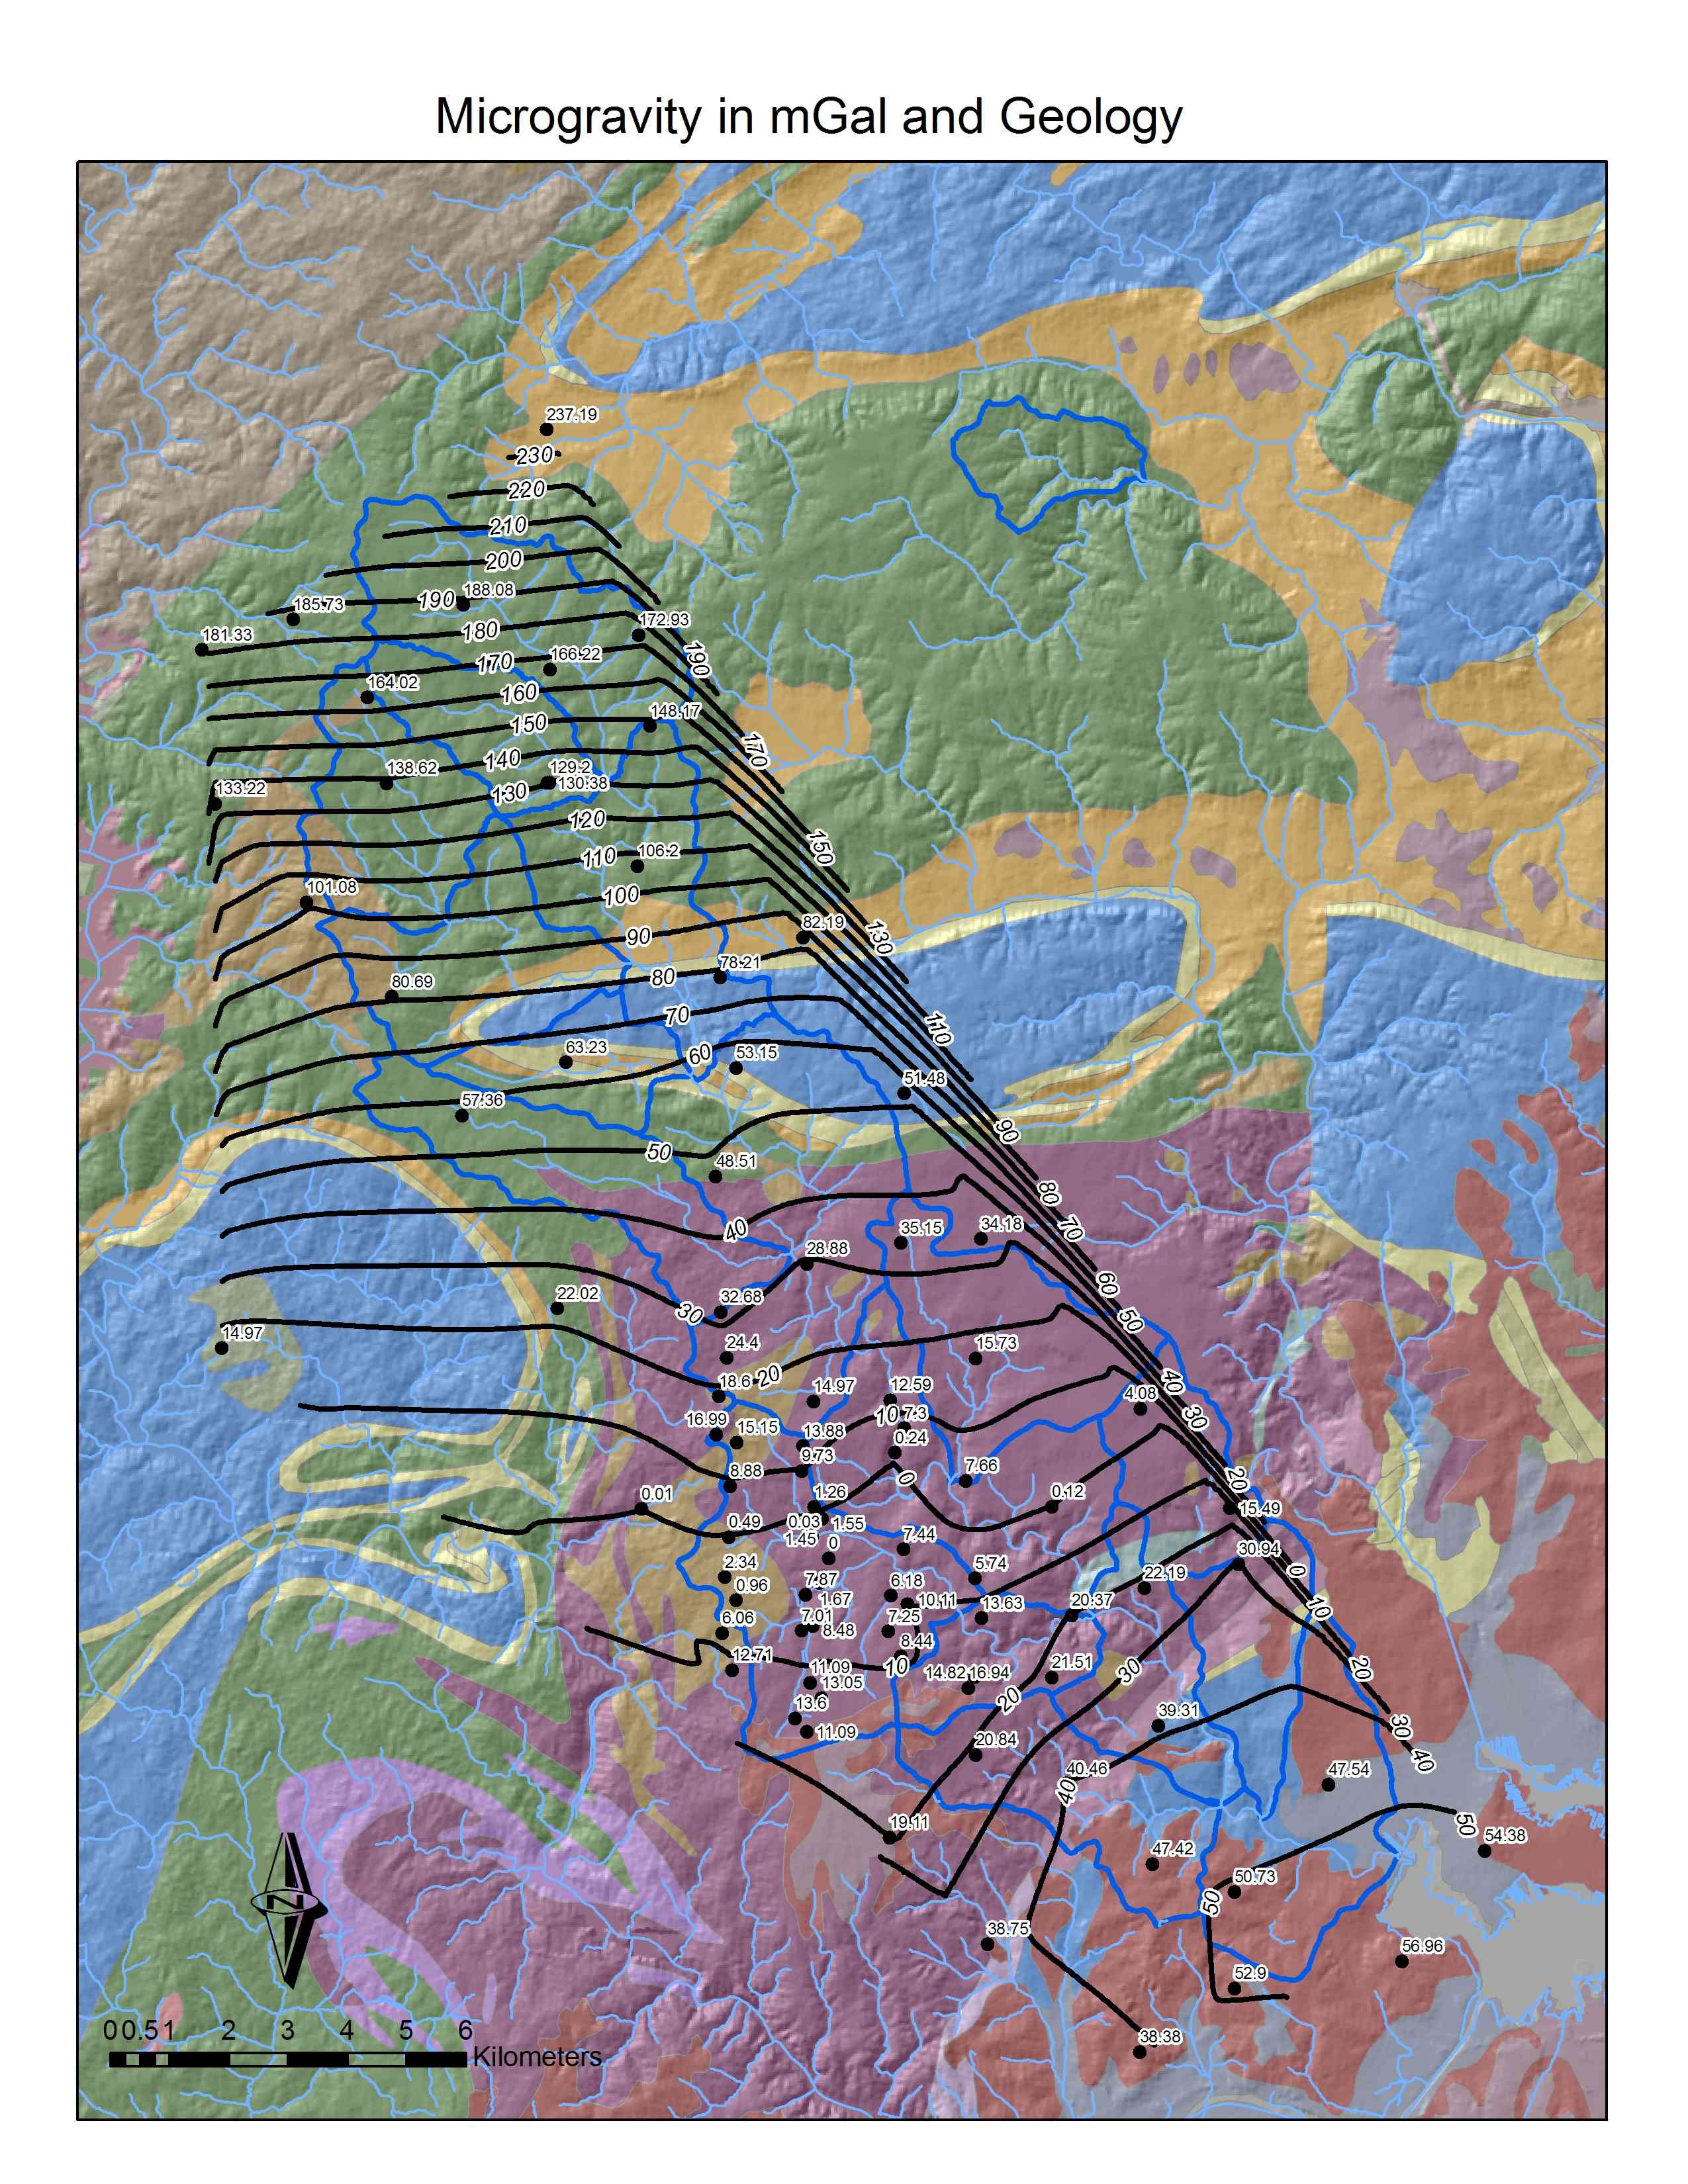 July 2007 microgravity map. |
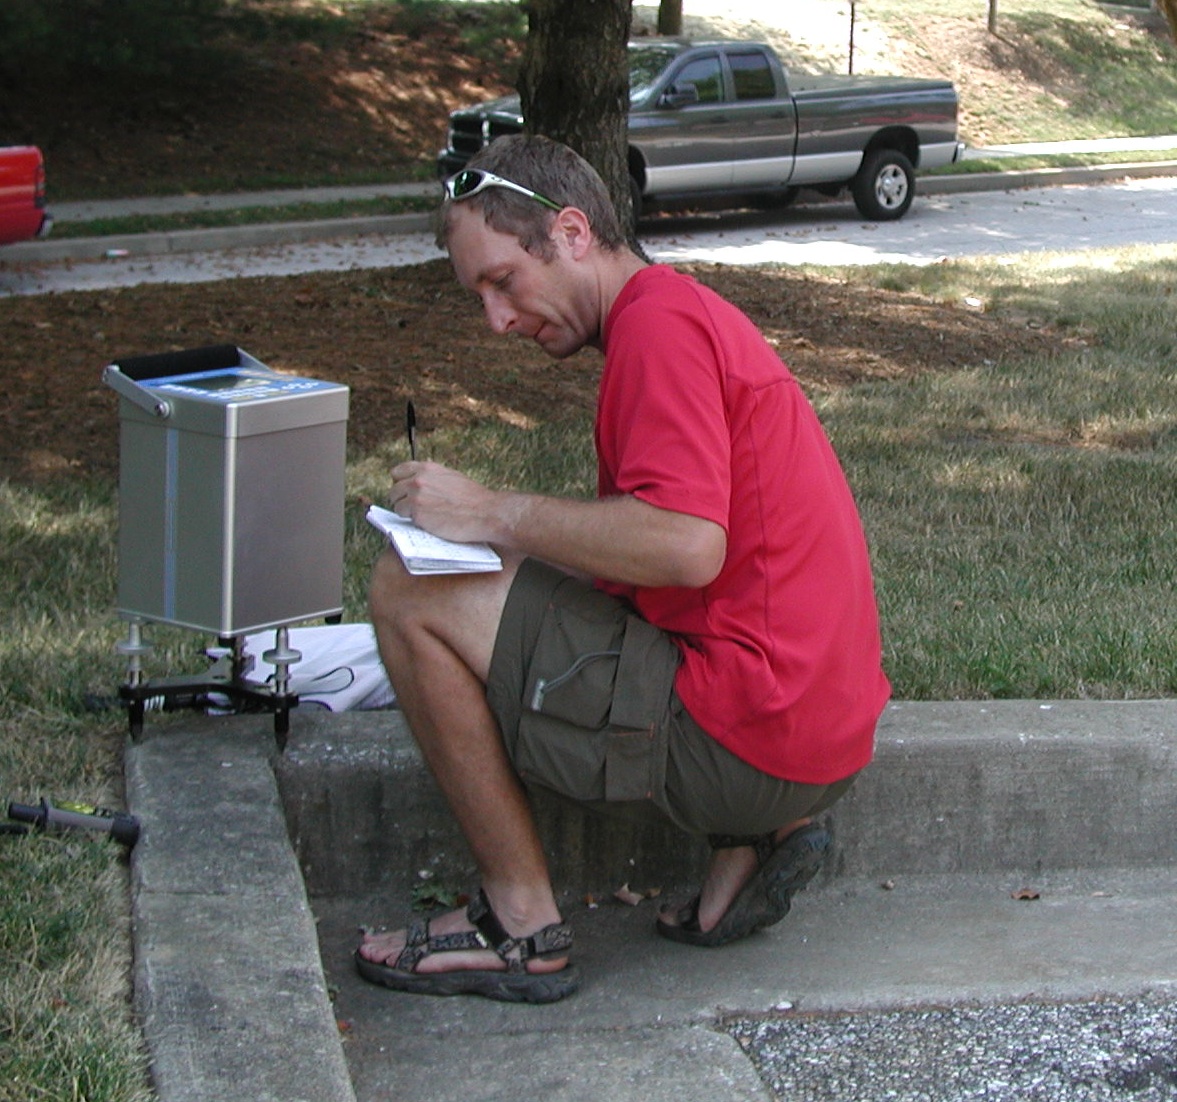 Nigel Crook taking a microgravity reading. |