UMBC
Department of Geography
& Environmental Systems
Advanced Cartographic
Design Project, Spring 2005
|
UMBC |
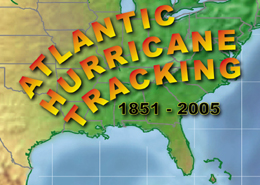
The table below provides access to Atlantic Hurricane Tracks from 1851 to 2005. Tracks are displayed in chart form with a corresponding data graph that lists the storm by name and duration. Each chart includes a color-coded Saphir-Simpson Scale, divided by category, that describes maximum wind speed in miles per hour. Only those storms reaching Hurricane Strength have been plotted and are listed by order of occurrence for the given year. NOTE: Maps based on modified NOAA data (see note below).
Year |
Decade |
|||||||||
| 1850's | ||||||||||
| 1860's | ||||||||||
| 1870's | ||||||||||
| 1880's | ||||||||||
| 1890's | ||||||||||
| 1900's | ||||||||||
| 1910's | ||||||||||
| 1920's | ||||||||||
| 1930's | ||||||||||
| 1940's | ||||||||||
| 1950's | ||||||||||
| 1960's | ||||||||||
| 1970's | ||||||||||
| 1980's | ||||||||||
| 1990's | ||||||||||
| 2000's | ||||||||||
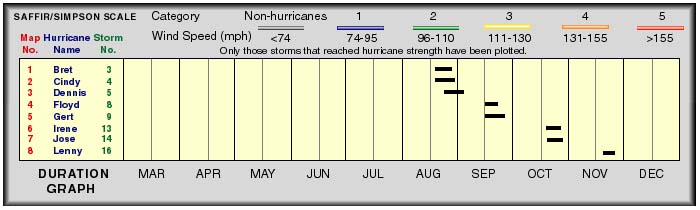
Each chart includes a color-coded Saphir-Simpson Scale, divided by category, that describes maximum wind speed in miles per hour. Only those storms reaching Hurricane Strength have been plotted. Hurricanes are listed by order of occurrence for the given year.
1850's
1860's
1870's
1880's
1890's
1900's
1910's
1920's
1930's
1940's
1950's
1960's
1970's
1980's
1990's
2000's
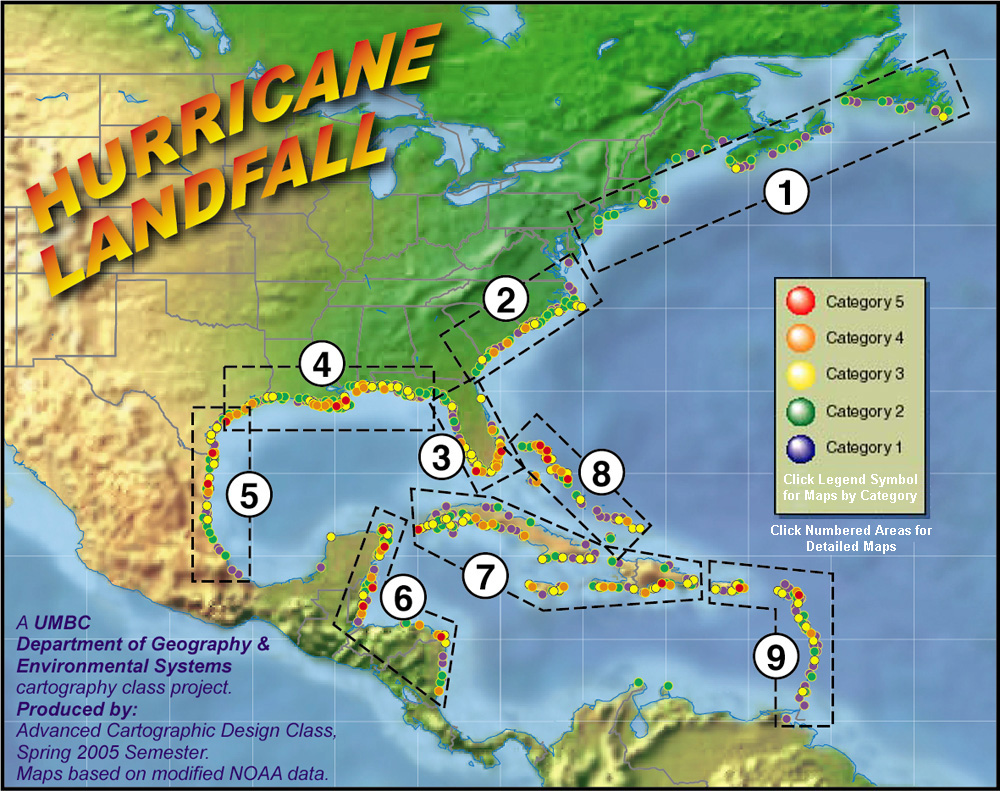
The Hurricane Landfall Link displays the total number of specific Hurricane Landfalls from 1851 to 2005. A legend provides links to individual categories and the dotted outlines link to close up views of the marked regions. Each chart includes a data graph that distributes the hurricane landfalls by month and category.
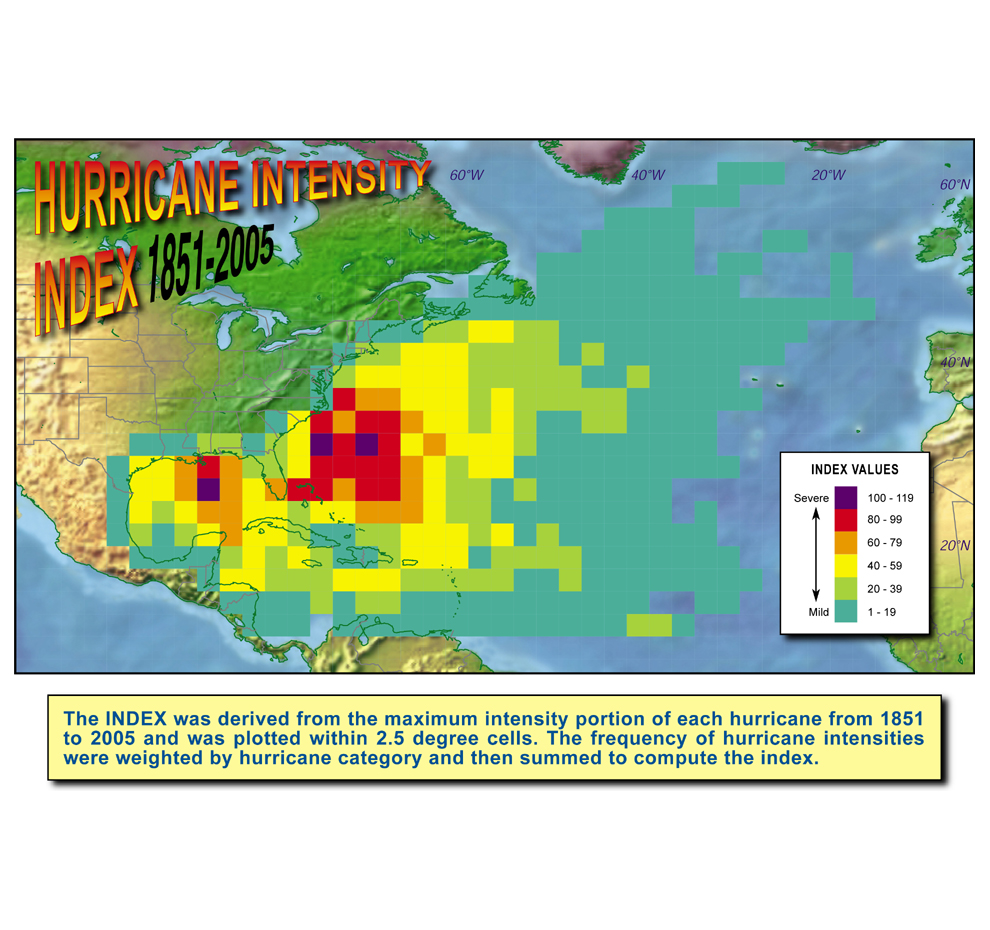
The Maximum Intensity Chart shows where hurricanes from 1851 to 2005 reached their maximum wind speed.
UMBC
2006
For more information on this site, contact:
Thomas D. Rabenhorst
Lecturer in Geography and Cartography
M.A., UMCP, 1972
Office: 211J Social Sciences
Email address: tom.rabenhorst@umbc.edu
Last modified
Nov 30, 2006