 Fig. 1
10-frame animation. Animated GIF movie, file size: 1.3 MB
Fig. 1
10-frame animation. Animated GIF movie, file size: 1.3 MBThis movie shows the evolution of the Fourier modes every ten periods of the dispersion map. The red dots show 749 noise realizations of the cw mode, and the blue dots show the same at f=10 GHz. The blob-like blue curve is a probability density contour under the assumption that the magnitude and the angles of the blue dots are independently Gaussian distributed. The radius of the green circle equals the average magnitude of the blue dots (the power of the 10 GHz tone of the noise-free soliton). The quantity r is the ratio of the angular to the radial half axis of the banana. A large value of r means that the banana wraps around the unit circle.
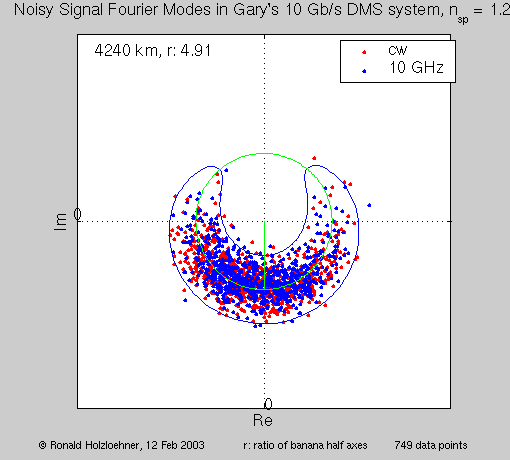 Fig. 2
Frame 4 of the above animation at 4240 km (40 maps).
PNG image, file size: 11 kB
Fig. 2
Frame 4 of the above animation at 4240 km (40 maps).
PNG image, file size: 11 kB Fig. 3
10-frame animation with jitter separation. Animated GIF movie, file size: 1.3 MB
Fig. 3
10-frame animation with jitter separation. Animated GIF movie, file size: 1.3 MBSimilar to Fig. 1,2, but after separation of phase and timing jitter [1]. The value of r is now close to 1. Interestingly, the jitter separation, if performed separately for multiple bit slots, tends to increase the magnitude of the cw mode, although the signal energy remains constant.
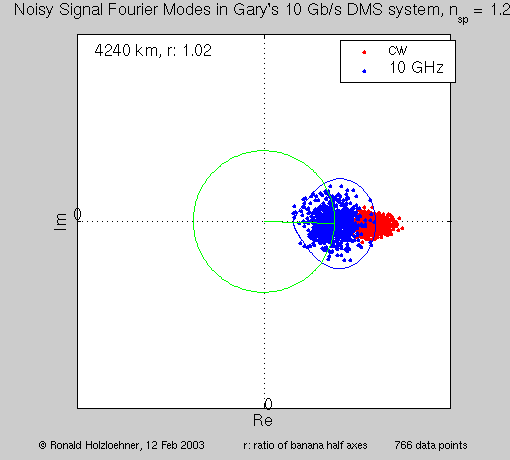 Fig. 4
Frame 4 of the above animation at 4240 km (40 maps).
PNG image, file size: 11 kB
Fig. 4
Frame 4 of the above animation at 4240 km (40 maps).
PNG image, file size: 11 kB